Which Media Kit Numbers Do Brands Actually Check?
Brands check your media kit against your profile before they reply. Here is which numbers they look at, and how to show them so they hold up.
Summarize with
7 min read

Jay Lalakiya
Founder of PostWithProof
TL;DR
Brands check follower count, average views and engagement rate first, then open your profile to see if they match. Honest numbers fail that check when they carry no window, use an unnamed engagement formula, or count things the brand can't see, like Facebook plays on a cross-posted reel. Label every figure with its window and source, and leave out what the platform doesn't publish.
Brands check three numbers in a media kit first: your follower count, your average views and your engagement rate. Then they open your profile in another tab to see whether those numbers look right. Many kits that fail that check aren't dishonest. They show a figure the brand can't reproduce from what the platform shows them.
I build PostWithProof, which makes media kits from the platforms' own data, so we run into the gap between what a kit says and what a profile shows every day. This guide covers which numbers get checked, the platform quirks that make honest numbers look wrong, and how to label yours so they hold up. If you're starting from zero, read what a media kit is first.
Why brands check your numbers
Brands check because fake numbers are common. In Influencer Marketing Hub's 2026 benchmark survey of more than 600 marketers, only 10.9% picked "none of the above" from its list of influencer fraud and quality problems. Fake or bot followers made up 56.5% of the problems reported.
So your kit is read as a claim, and your profile is the evidence. The check itself is predictable: brands look at the same handful of figures, and each one has a right and a wrong way to be shown.
The numbers brands look at first
Followers and subscribers
This is the one number a brand can verify in a second, so it has to match what they see. On YouTube, public subscriber counts are abbreviated: past 1,000 they're cut to three significant figures and rounded down, so a channel with 133,017 subscribers shows "133K" until it reaches 134,000. Quote the same rounded figure your channel page shows. The exact count in YouTube Studio is real, but a brand can't see it, and a number they can't see reads as a mismatch.
Average views
Average views per post is how a brand estimates what a sponsored post will earn. Two details decide whether yours holds up:
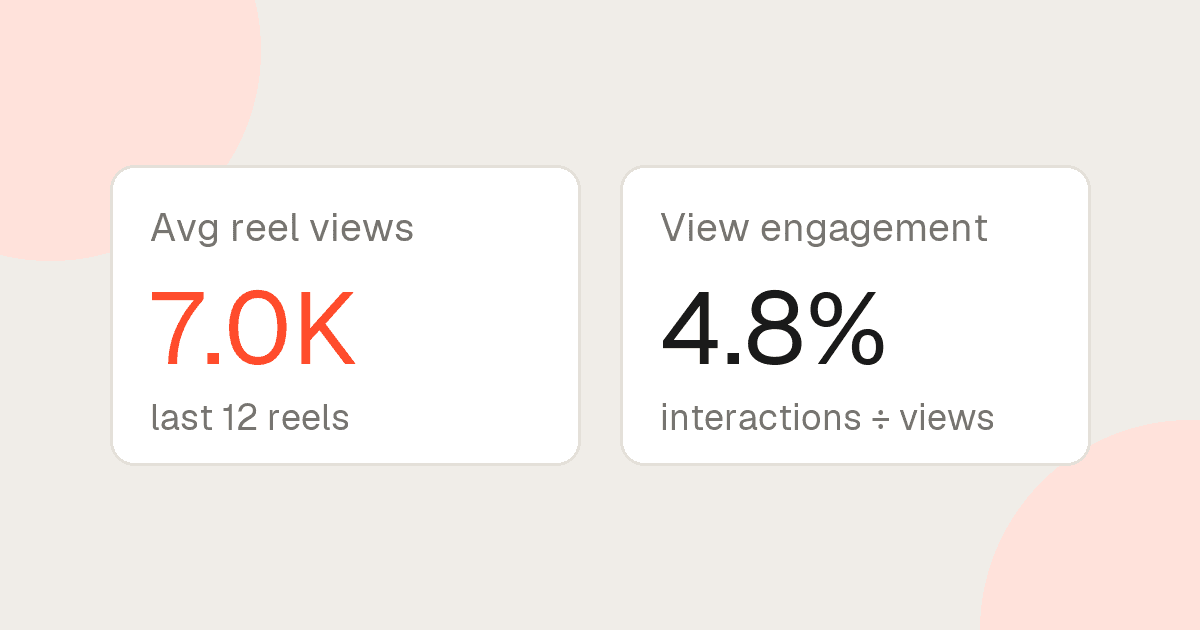
- Say how many posts the average covers. "Avg reel views · last 12 reels" is something a brand can check; "Avg views" is not.
- On Instagram, only videos show a public view count. Instagram made views the main metric for every format in 2024, but for photos and carousels that number lives in your Insights, where only you can see it. An average that mixes those posts in with zero views comes out artificially low.
Engagement rate
Engagement rate is the number brands compare most across creators, and the one most often calculated differently from one kit to the next. It gets its own section.
Engagement rate has more than one definition
There is no single engagement rate. There are three common formulas, and they give different numbers for the same account:
| Formula | What it needs | Where it's used |
|---|---|---|
| Interactions ÷ followers | Public data | Comparing any public profile with others |
| Interactions ÷ reach | Your platform insights | Campaign reports; closest to the platform's own view |
| Interactions ÷ views | Public data for video | Video-first creators, reels and Shorts |
Follower-based rates run lower than reach- or view-based rates for the same account, and they flatter small accounts over large ones. A kit that shows "Engagement 6.2%" without saying which formula produced it invites the brand to work it out themselves, get a different number, and conclude the kit is wrong. Put the denominator in the label: "View engagement rate" or "Follower engagement rate". Our free engagement rate calculator shows the working for YouTube, and there's an Instagram version too.
Why honest numbers can look wrong
These are the cases where your number is correct and still fails the check, because the brand is looking at a different number.
Reels shared to Facebook
When we measured one creator's reel that had also been shared to her Facebook Page, it showed about 6,100 plays to a logged-out visitor and about 20,000 to a logged-in one. The difference was almost exactly the 14,000 plays the reel had on Facebook: logged in, Instagram showed the two combined. On a reel she hadn't shared to Facebook, the two counts matched within 2%.
A brand scrolling your profile logged in may see the combined figure. A kit built from public data shows the Instagram-only one. Neither is wrong, but if you quote reel views, say which one it is.
Hidden like counts
Instagram lets you hide like counts on any post or reel. Hidden is not zero. If your kit averages likes, leave the hidden posts out of the average instead of counting them as nothing, and say how many posts the average covers.
Pinned posts
Pinned posts stay at the top of your grid whatever their age. A pinned post from two years ago sitting in a "latest posts" row makes the whole row look stale, and it quietly pulls a "recent" average toward an old result. Leave pinned posts out of anything you label as recent.
How to show your numbers so they hold up
Follow these steps for every figure in your kit:
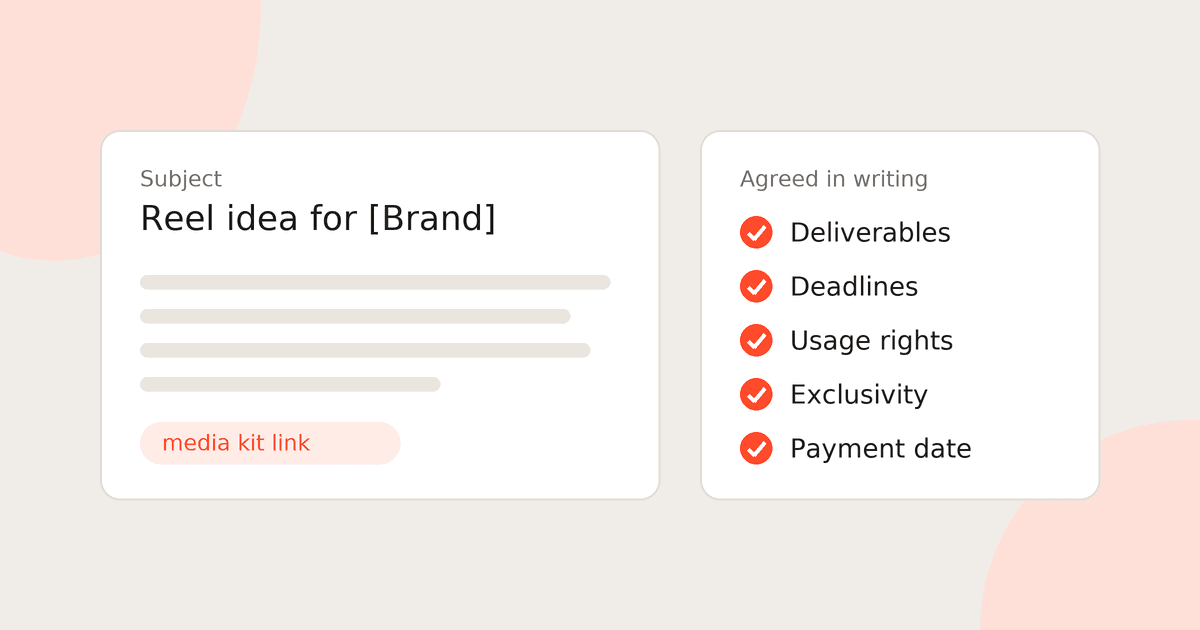
- Give each number a window. Write "last 30 days" or "last 12 reels" under the figure, every time.
- Name the formula behind every rate.
- Never label a sum of recent posts as a total. "Total likes 1.2K" next to "909 posts" reads as about one like per post.
- Leave out a figure the platform doesn't publish rather than show a zero it never measured.
- Say where a number comes from when it isn't what the brand will see, like Facebook plays on a cross-posted reel.
- Update the kit before you send it. A number that was right in March and wrong in September still reads as wrong.
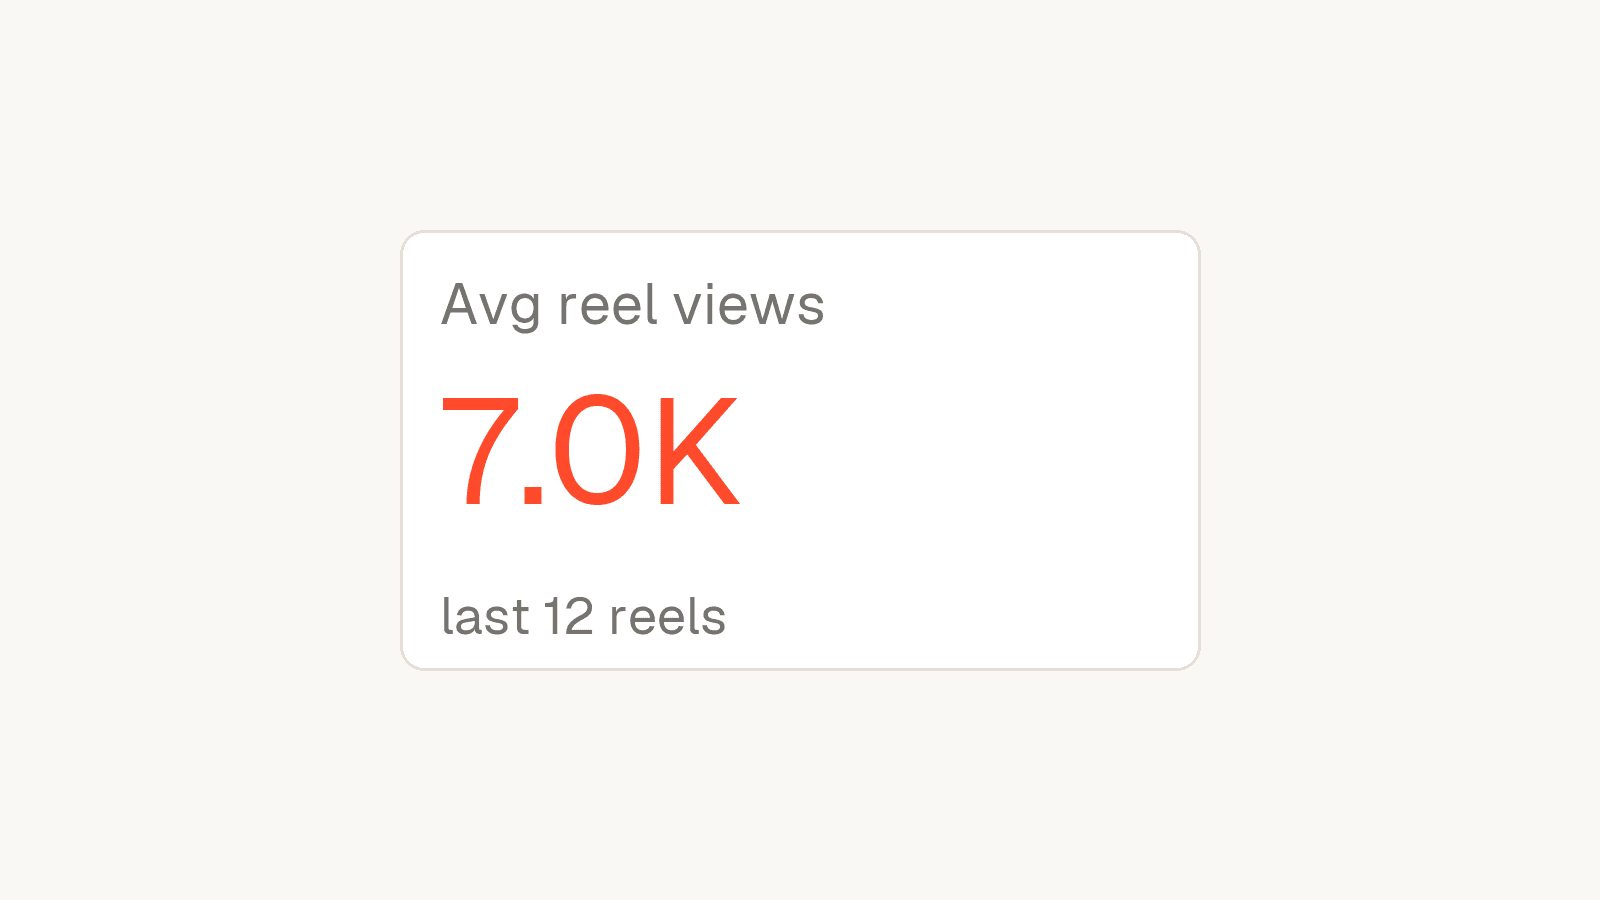
A tile like this answers the brand's question before they ask it: what the number is, and what it covers.
We made these mistakes too
Everything above we learned the hard way. A creator we had built a kit for looked at it and told us the information was incorrect. When we dug in, our public-data kits were showing things like "Total likes 1.2K" beside "909 posts": the posts were a lifetime count and the likes were the sum of the last six reels. By our own arithmetic the kit was consistent. To the one person who knew the real numbers, it was wrong, and they were right.
Since then every number on a PostWithProof kit carries its window and says where it came from: public data anyone can see, or figures read from Instagram or YouTube with the creator's permission.
A brand doesn't need your numbers to be big. It needs them to be checkable.
Where to go from here
Start from a layout that already labels its numbers: browse the media kit templates, and see how real creators present theirs on the media kit examples page. When you're ready, compare plans to decide how often you want your stats refreshed.
Create your media kit with PostWithProof
- Ready in 60 seconds
- Auto-updates every day
- One live link brands can open anywhere